
Geospatial data is the geographic data around us, it contains location information as well as extra information known as attribute information. This data can range from things like smart phones GPS information to voting preferences across a country to natural geographic features like the distribution of natural water sources, amongst other many things. Through analysing it valuable insights can be gained with many different uses. Placement of advertising billboards could be optimised using commuter smartphone GPS information, voting preferences across a country could be used in deciding localised targeted voting campaigns, city planners could choose the location of new housing builds based on the proximity of water supplies, and so on. Whilst geospatial data presents vast ways to study and gain insights into our world it also presents unique challenges for analysis.
A two-day blended workshop of online lectures and practical python programming sessions was delivered by Chris Jochem, a Senior Research Fellow of the WorldPop group in the School of Geography and Environmental Sciences at the University of Southampton. This workshop covered key fundamentals of geospatial data analysis, including spatial data formats, georeferencing, geometry calculations, spatial analysis, and visualisations, and used the useful geospatial data analysis python package GeoPandas, an extension of the pandas package that allows for spatial operations on geometric types.
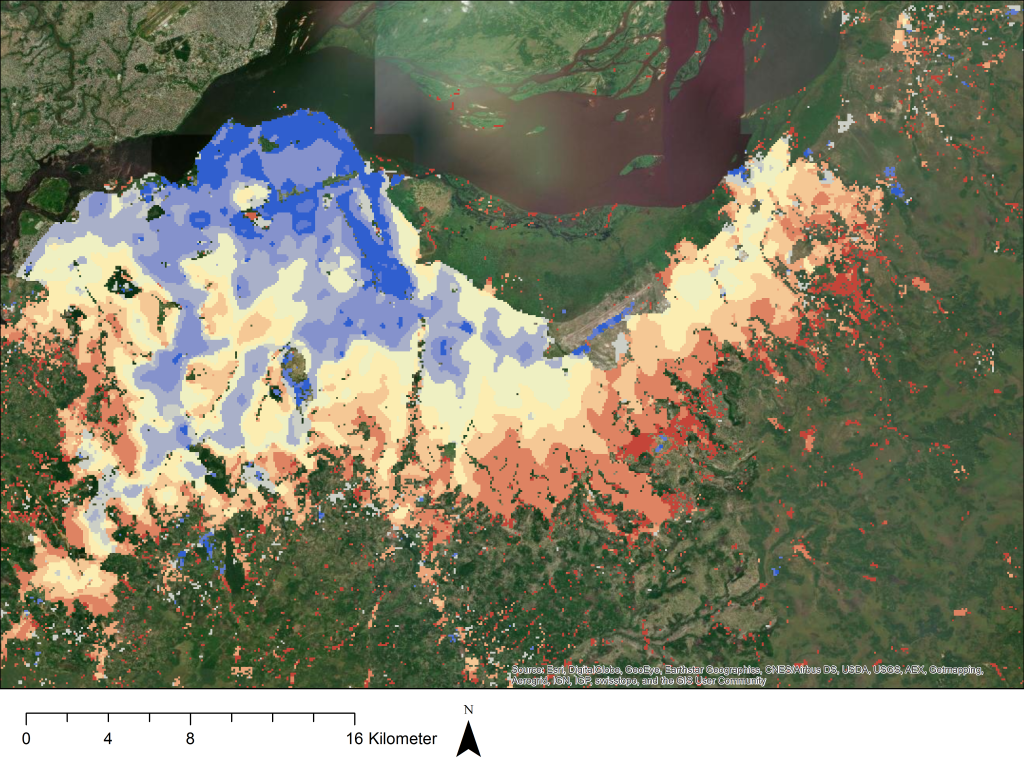
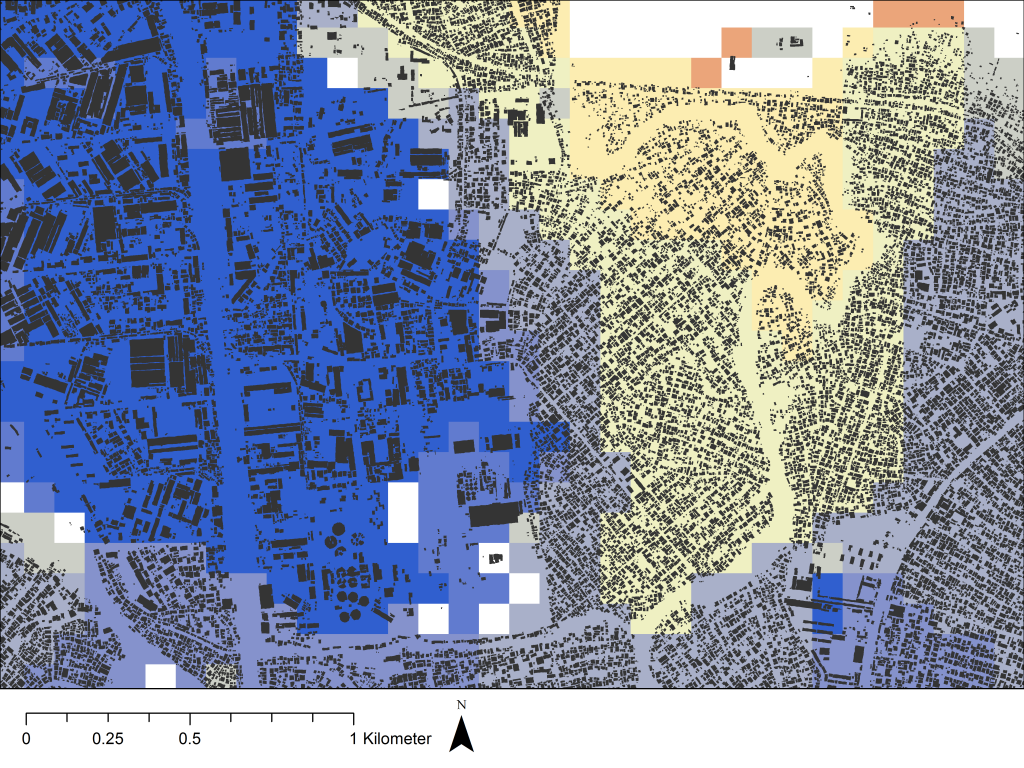
For geospatial data there are different types of representations. The main one focused on in this workshop was the vector representation, which consists of point locations of objects and bodies that can then be joined together to form lines and polygons. The other main representation is the raster representation which uses a grided representation of continuous data. As geospatial data contains geographic information it can be linked onto maps of that geographical area.
Maps are typically 2D representations of the Earth yet the Earth itself is 3D and so these 2D representations introduce different types of distortions. Each type of map, known as a projection, has different levels and types of distortions and so the choice of map has both pros and cons (relevant xkcd, because relevant xkcd: https://xkcd.com/977/). Once a map is chosen a coordinate reference system (CRS) is added, which defines how points on the map relate to real places on Earth.
Once the map and CRS are ready other information and data can be added as layers. This typically involves performing geometric manipulations and non-spatial data operations in a pre-processing stage to extract data specific to the region of interest from larger datasets and to clean and combine relevant datasets. These operations can include clipping, spatial joining, non-spatial joining, dissolving and aggregation, amongst others. Once the pre-processing is done the data can then be analysed.
Through analysing the data valuable insights and information, such as the ones previously mentioned, can be found. The results from the analysis alone though do not best show and communicate the trends and insights and so they need to be visualised in ways that clearly communicate their message to an audience.
This was the final part of the workshop and it covered visualisations from point maps to choropleth maps to interactive marker, choropleth and heat maps, with the interactive maps showing extra information when the user interacted with them. These maps help convey the insights better to the user as they show the trends in clear and concise ways whilst also being better at holding the user’s attention.
This workshop was both invaluable and interesting. It covered the core concepts of geospatial data analysis, from what geospatial data and analysis is up to how to use it to process, analyse and present geospatial data in meaningful ways.
By Samuel Senior